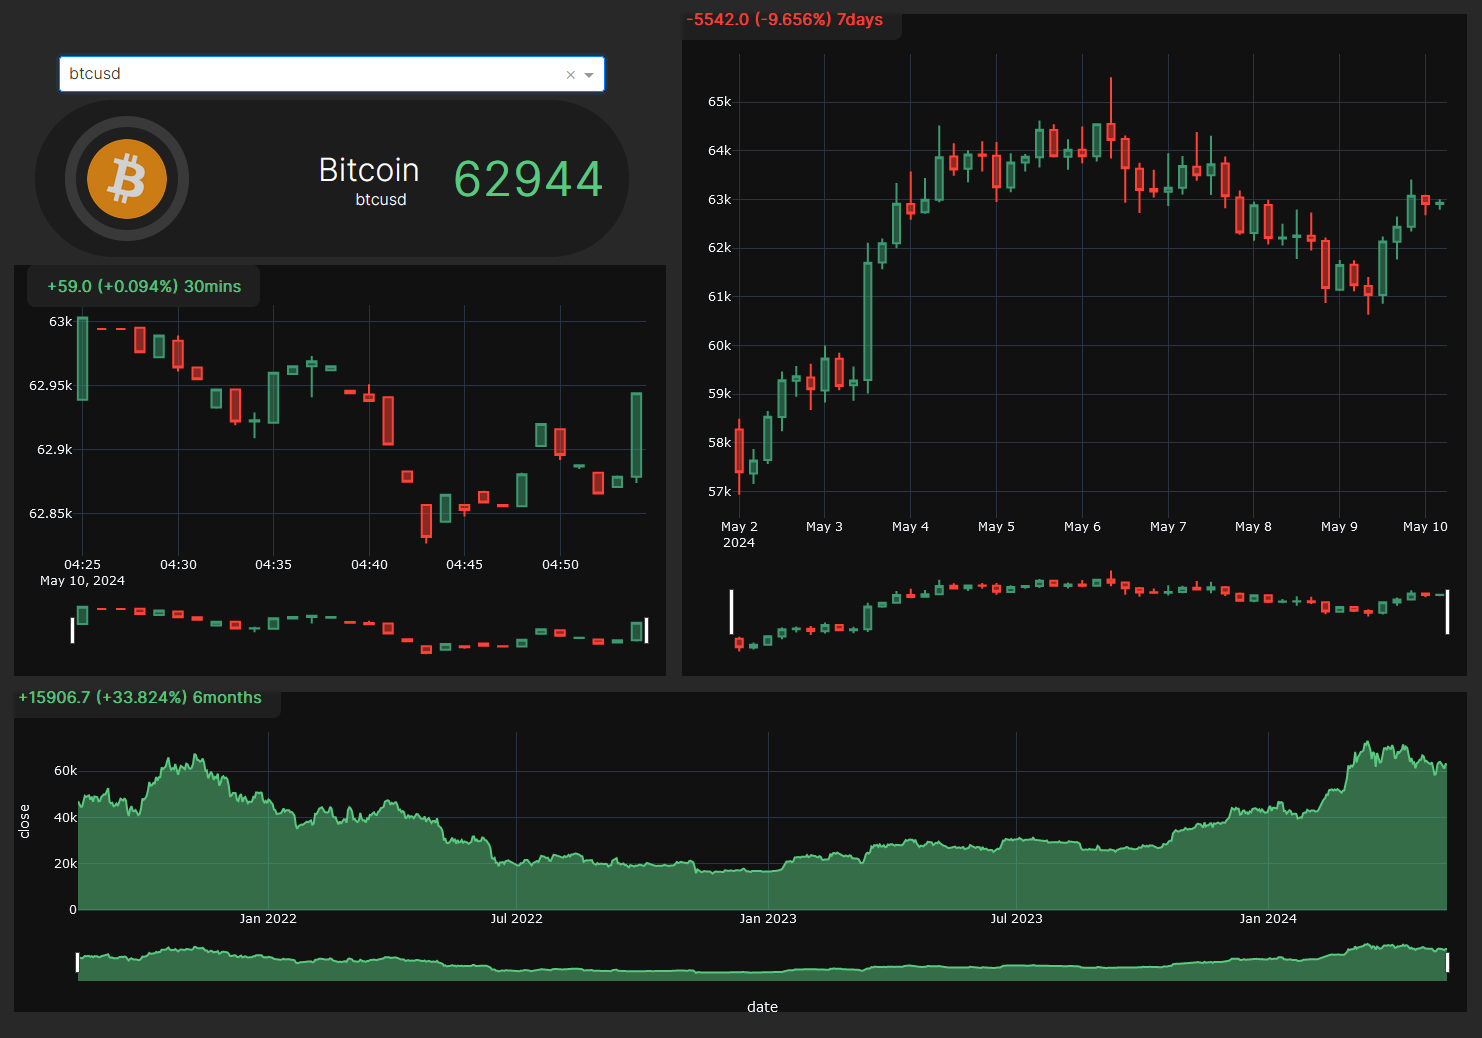
Live-Crypto Visualizer
Case StudyPersonalSep 2022
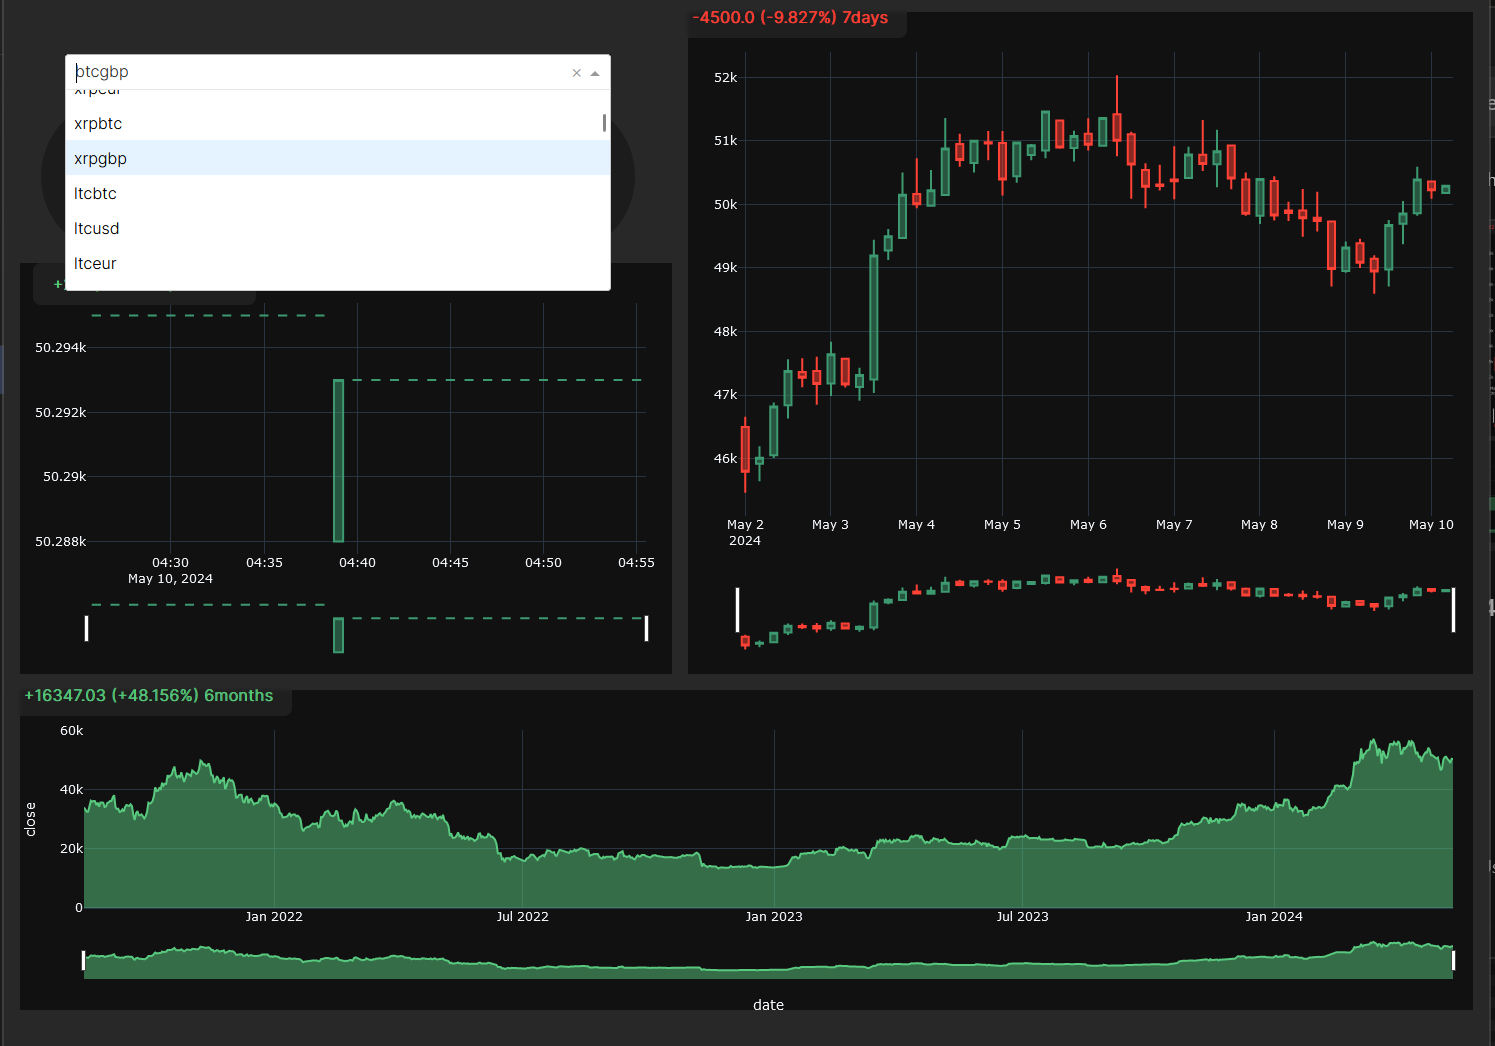
Real-time market data, Percentage of Profit / Loss of 30 mins, 7 and 6 months, Candle Stick Graph for short term Line Graph for long term
Technology Stack
PROJECT_ID: CRYPTO
Media
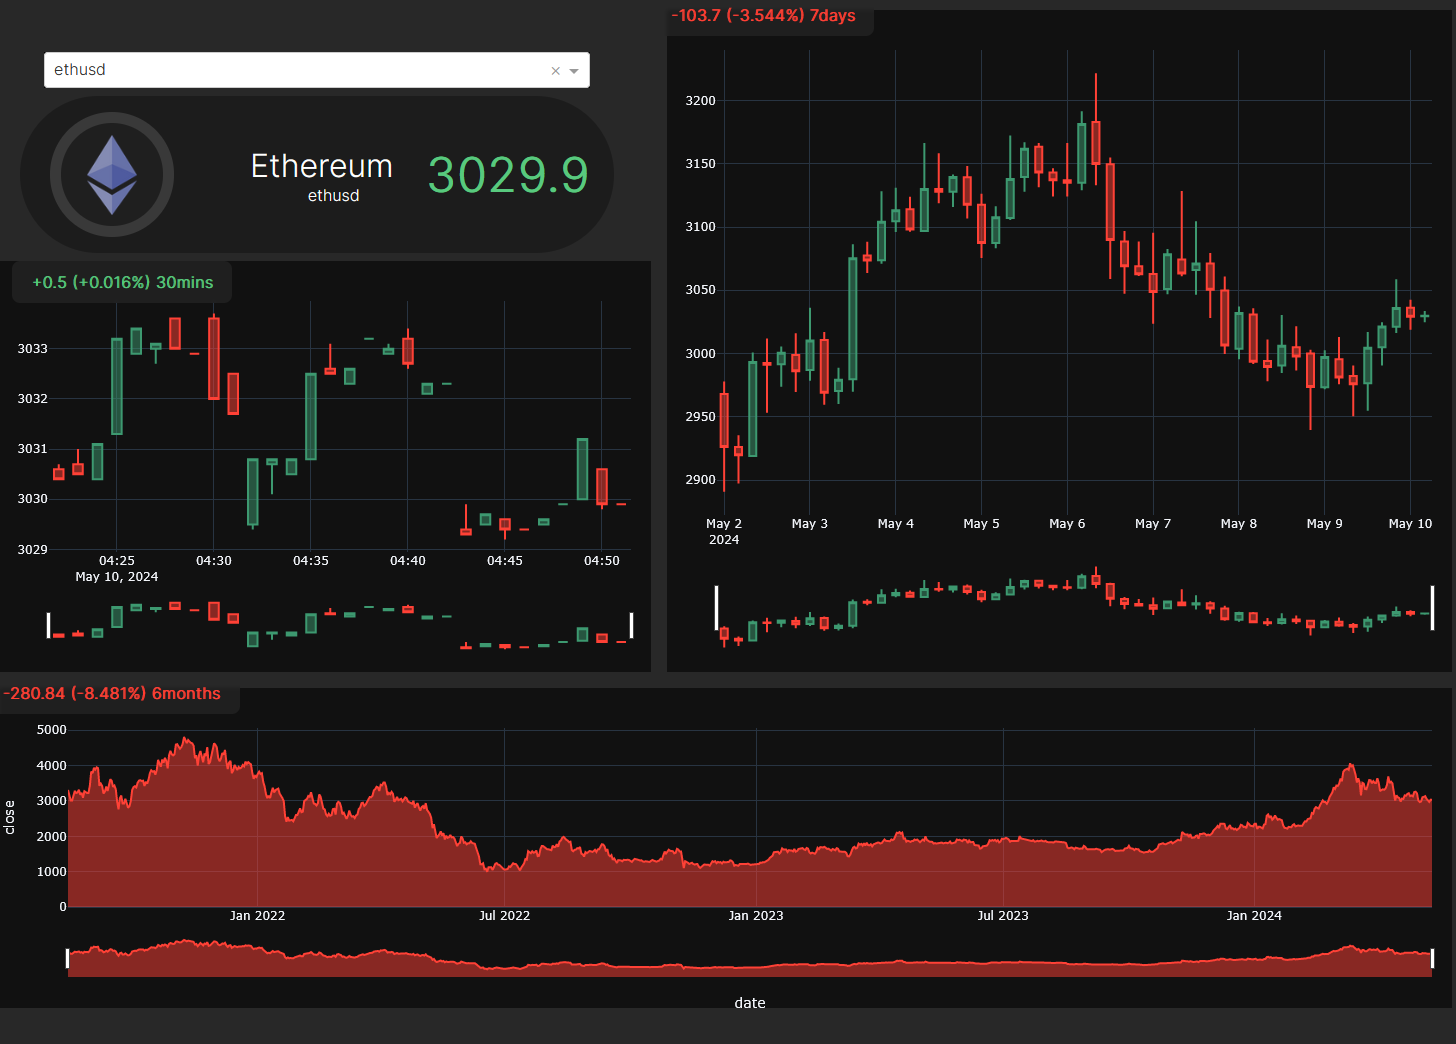
Image Carousel
Project Navigation
Navigate Projects
Use these cards to move to the previous or next case study.